Evolving the World Bank’s Twin Goals
January 26, 2023
The World Bank management’s Evolution Roadmap suggests the institution is reconsidering its ‘twin goals’ mission statement of eradicating extreme poverty (ending $2.15 poverty by 2030) and boosting shared prosperity (raising the incomes of the bottom 40 percent in each country).
“nearly half the world – over 3 billion people – lives on less than US$6.85 per day, the average of the national poverty lines of upper-middle income countries… The WBG [World Bank Group] could consider adding a higher poverty line to be targeted alongside extreme [$2.15] poverty. This might align with the WBG’s principle to “serve all clients”, including urgently supporting poor people in MICs…. The current metric of shared prosperity measures the extent to which economic growth is inclusive, by focusing on household consumption or income growth among the bottom 40 percent of the population, but not whether growth is sufficient to raise overall prosperity. The evolution exercise will review the current approach and explore the possibility of using new indicators for measuring prosperity. Approaches to be explored include adding a focus on raising national median income and paying enhanced attention to the gaps in prosperity between countries, among other options.”
It is reassuring that Bank management wants to keep the twin goals focused on consumption and prosperity. It is an important counterblast against those who see progress on the number of people living under the $2.15/day poverty line and suggest that the fight against poverty is close to being won, and other priorities can take center stage—as if $2.16 is an adequate daily consumption for a high quality of life. But the proposed fixes to the twin goals, alongside the Bank’s existing approach to higher poverty lines, are a mistake.
One poverty line to keep….
Sadly, according to a World Bank staff forecast, there will still be plenty of people living under $2.15 poverty in 2030—and there may still be people living under $2.15 a day in 2210. As long as the World Bank finally fixes the line rather than changing the calculation method every few years, the extreme poverty line should remain as an important indicator of global progress against poverty.
Meanwhile, the roadmap’s suggestion that focusing on consumption growth among the bottom 40 percent may not be a good indicator of “whether growth is sufficient to raise overall prosperity” is an interesting if perhaps ungrounded repudiation of the evidence presented in one of the World Bank research department’s most cited papers: “Growth is Good for the Poor.” That the average incomes of the poorest quintile rise proportionately with average incomes overall also implies prosperity overall rise with the incomes of the poorest quintile (and the one above). Of course, the second twin goal is also an inequality target, about reducing income gaps within countries, but is hardly (or even primarily) only that. If there is a problem with the current goals it is that they say too little about inequality, not too much.
…three lines to drop
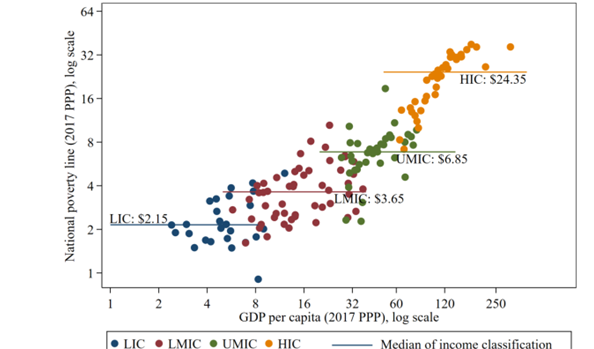
Meanwhile, the Bank’s research department has proposed a number of higher poverty lines. Alongside the $2.15 “extreme” poverty line that is the median national poverty line of all of the countries defined by the Bank as “low income,” we have the median of lower middle income country poverty lines ($3.65), upper middle income poverty lines (the $6.85 figure referred to by the Roadmap), and high-income country poverty lines ($24.35), all expressed in purchasing power parity (PPP) using the latest round of PPP data.
This approach is odd for two reasons. First, it puts steps in a relationship that clearly wants to be a slope (see the figure below taken from the Bank’s website). Second, the steps it creates are based on the Bank’s income classification for countries. Unlike the poverty lines and poverty data, which use purchasing power parity, these steps use market GDP per capita (using the Atlas method) to create groupings (which is why those groupings overlap when put on an x-axis in PPP GDP per capita). And those groupings are made on the basis of market GNI per capita cutoffs set in 1989, in turn related to earlier Bank operational policies. This all seems a strange way to decide which countries see more or less relative poverty.
So, when it comes to an absolute poverty line, $2.15 sadly has life in it yet. And any new higher absolute global line will be an arbitrary cutoff, and a very odd cutoff using the Bank’s current approach. Again, while everyone worldwide should be living on much more than $6.85 a day, or even $24.35 a day, a much higher line set as a target for World Bank attention would also shift focus away from the countries where most of the poorest people still live. And any such line will simply mask a more significant general truth: a declining marginal return to consumption in terms of everything from health through happiness to housing standards means that (all else equal) the World Bank is likely to have the greatest impact on global quality of life the more it invests in the world’s poorest people. Better to focus on those below $10 a day than above, better to focus on those below $5 a day than above, better to focus on those living on below $2.15 a day than those above. That’s true within and across countries and should be the primary guide as to where the World Bank directs subsidized finance in particular.
A new first goal: Maximizing consumption growth
When it comes to global poverty reduction, the Bank should deploy its subsidized resources with the goal of maximum individual consumption growth in developing countries. That means, in terms of goal accomplishment, it would value a dollar of investment equally if it raises consumption from $1 to $2 a day or $10 to $20. Or, put it another way: $1 million in World Bank grant resources used for an investment that has an annuity value of $10,000 a year in a population living on $1/day would be valued from the point of progress toward the goal the same as $1 million in World Bank grant resources that has an annuity value of $100,000 a year in a population living on $10/day.
That suggests the first goal for the institution could be to minimize the number below the poverty line, and maximize growth away from that line. To measure global progress on that, it would continue to report on $2.15 poverty (although fixing the line in real terms), and, for those over $2.15 consumption, add a measure of the average log distance between consumption and $2.15 for the population of World Bank client countries. (Of course, the World Bank Group’s own contribution to that global progress will be small: its annual operations are worth about 0.2 percent of the GDP of client countries).
A second goal: focusing on relative poverty within countries
With regard to relative poverty, if the goal of the Bank’s higher poverty lines is to calculate how many people are in relative poverty worldwide and to focus (primarily market-rate resources) on those in relative poverty, it would be far better to use a common metric, one that abandons reliance on artificial breaks in the poverty line-income relationship and mixing market and purchasing power parity incomes. In addition, it would surely be good to hew to the Bank’s approach of using national poverty lines as a basis, and perhaps even better to stick to one source of income data (national surveys).
A simple approach would be to take the average global national poverty line as a percentage of mean consumption. Using data from the World Bank’s poverty calculations and website it appears that, around the world, the poverty line is set at an average of about 54 percent of mean consumption. The Bank’s goal (and relative poverty line) could be to maximize the consumption of people living on less than fifty percent of average consumption in their country, then. This is broadly the approach to relative poverty proposed by Shaohua Chen and Martin Ravallion in 2000 based on earlier work by Atkinson and Bourguignon. It is also only a little different from the current focus on the bottom forty percent of the income distribution, but better aligned with national definitions of poverty.
That said, the relationship between poverty lines and mean consumption looks a little more complex than a flat line (see the figure below—and once again this was noted by Chen and Ravallion a long time back). Poorer countries set poverty lines closer to mean incomes. If the Bank wanted to take that into account, it could use the cross-county relationship between the two to set the poverty line at a given mean consumption. Other approaches would be to adopt a moving average (use the poverty line/mean income of the closest twenty countries in terms of mean income) or a different functional form. But creating arbitrary steps in the data using arbitrary market income classifications based on World Bank operational policies seems just utterly too random. Surely the Bank can do better.
Do we need a third goal?
This leaves the question of the potential need for a new goal in an institution dedicated to do more on climate and other global public goods. The current approach simply suggests that the progress we want to see regarding relative and absolutely poverty should be sustainable, and perhaps that is adequate. But it is important to ensure that the activities the World Bank finances are effective, and so it might be worth spelling out that the institution supports the provision of global public goods when they are cost effective tool to meet the twin goals. For some shareholders, that is probably not enough: they want the institution to add a whole new mandate and focus on global public goods beyond their specific link to global prosperity and poverty reduction. But I think that is opening the door to making poor people pay twice for climate change and pandemics.
Regardless, both when it comes to ‘absolute’ poverty and relative poverty, the World Bank is over-fond of drawing lines through global income and consumption data, and the roadmap is a good time to evolve beyond that. The World Bank Group’s goals should be: (i) ending extreme poverty defined as living below the $2.15 a day poverty line, and maximizing consumption growth away from that line; (ii) sustainably increasing the living standards of people in every country living on less than fifty percent of average consumption in that country; and (iii) supporting the provision of global public goods when they are cost effective tools to meet the first two goals. Finally, it might worth making explicit that the first goal is primarily designed to focus the use of subsidized resources (IDA, trust funds), and the second to focus the use of market-rate resources (IFC, IBRD).
Figure: Poverty Line/Mean Income Against Mean Income
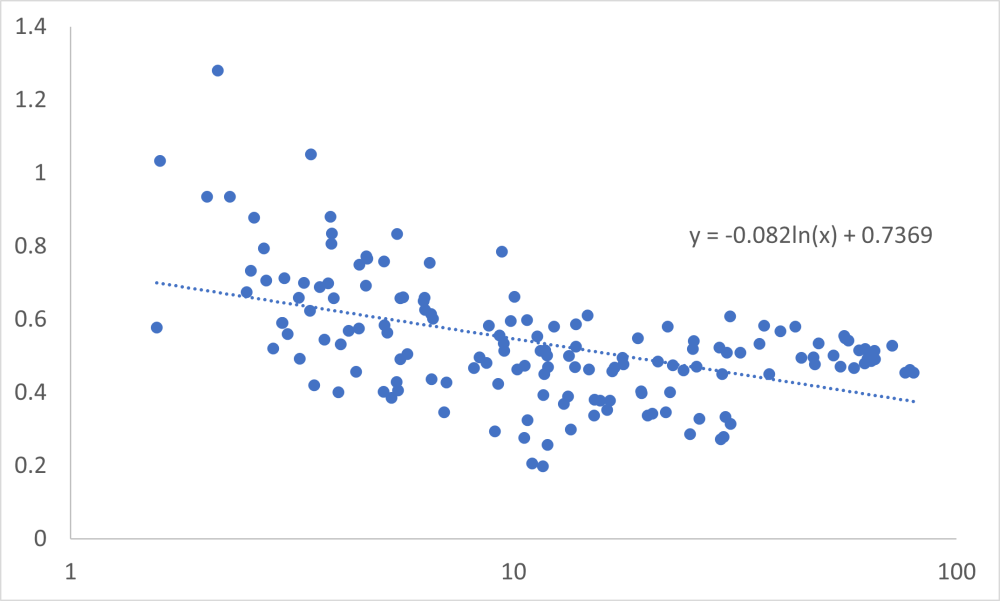
Sources: https://pip.worldbank.org/poverty-calculator for mean consumption/income, https://ourworldindata.org/from-1-90-to-2-15-a-day-the-updated-international-poverty-line for poverty lines and GDP per capita. Note some of this data refers to income rather than consumption. The clustering of values at the top end of incomes is likely because the data comes from the OECD and, rather than national poverty lines, is share of population living on less than 60% of median income after transfers (see Table B1 here)
Learn more